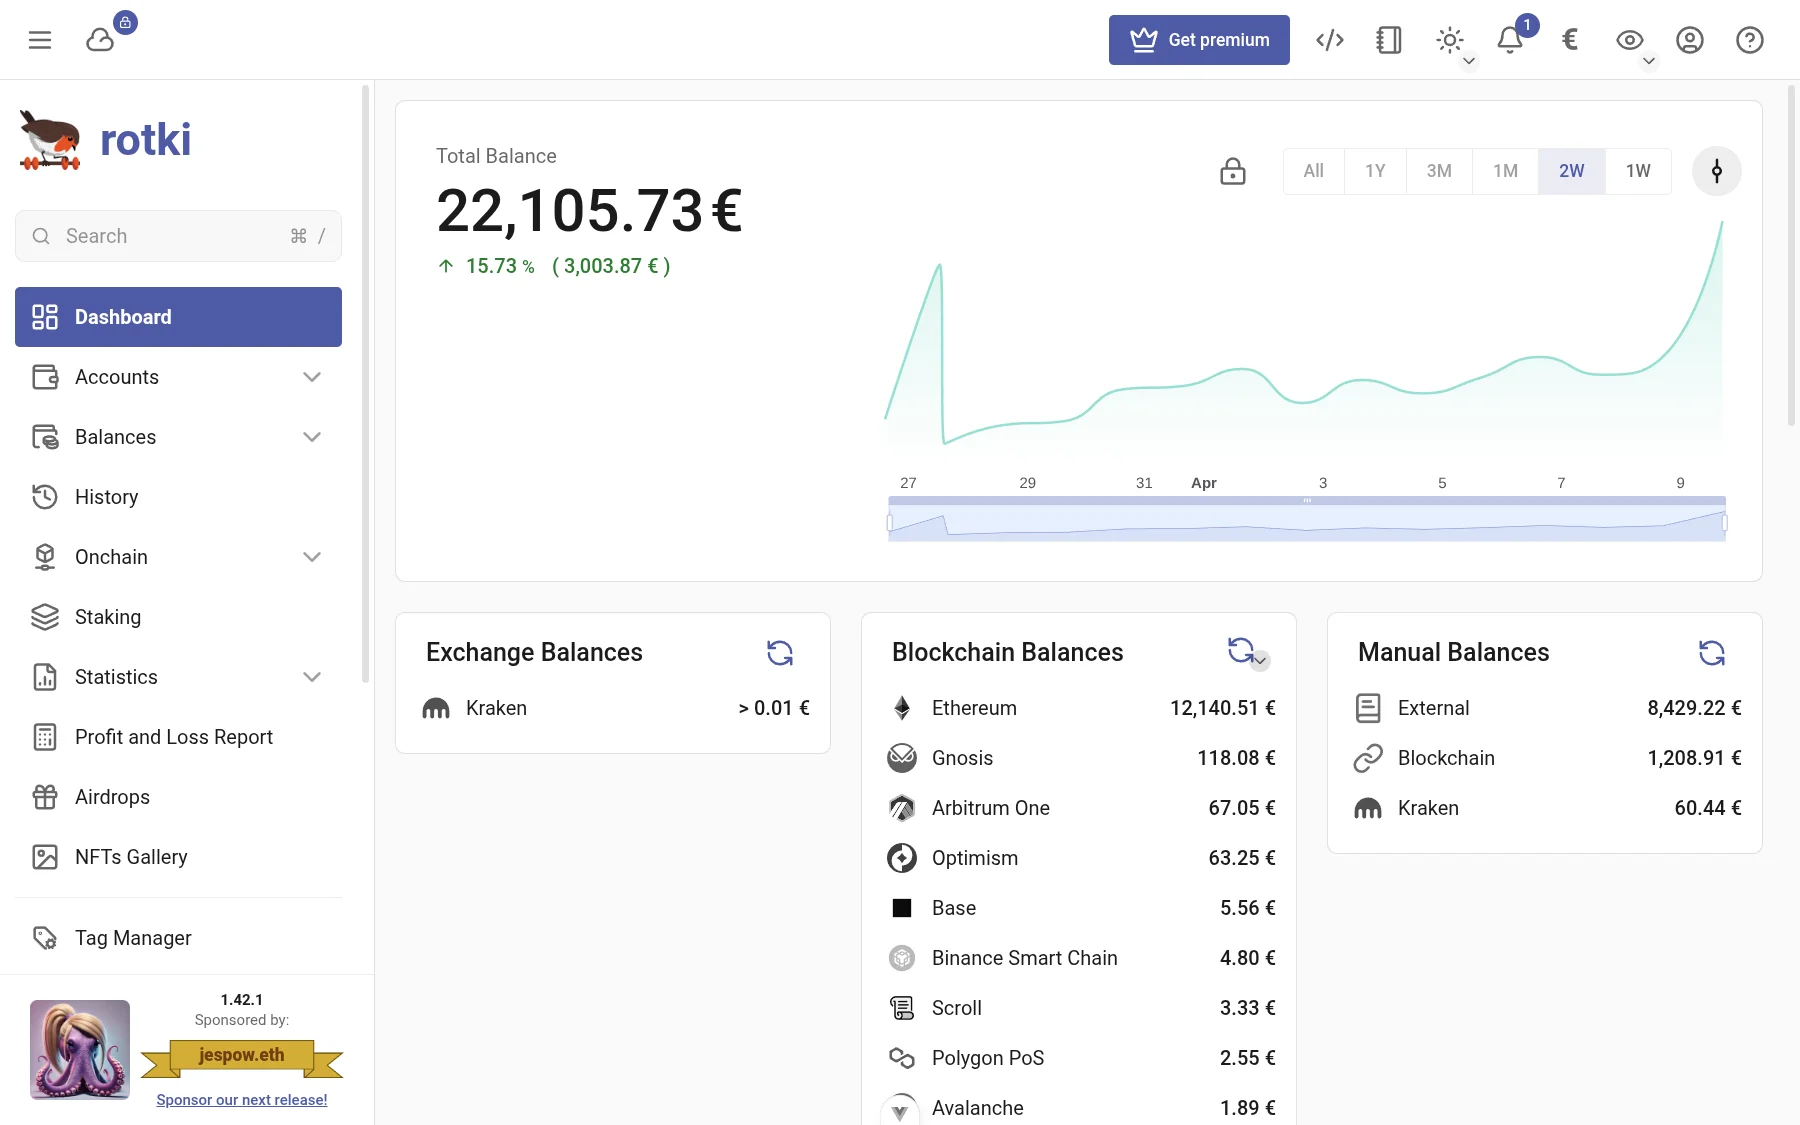
Dashboard
The dashboard is the first page you see after logging into rotki. It provides a high-level overview of your entire portfolio across all tracked accounts, exchanges, and manual balances.
Progress Indicator
At the top of the dashboard, a progress indicator shows the status of ongoing operations such as balance queries, history event fetching, and historical balance processing. This bar appears automatically when rotki is working and can be dismissed.
Total Balance
Your Total Balance is displayed in your configured profit currency. This is the combined value of all your assets across every tracked source — blockchain accounts, exchange balances, and manual entries.
Below the total, a change indicator shows:
- A green arrow up with the percentage and absolute gain if your portfolio increased
- A red arrow down with the percentage and absolute loss if it decreased
- A gray horizontal arrow if there is no change
The change is calculated relative to the earliest snapshot in the selected timeframe.
Net Value Graph
The graph visualizes your portfolio's total value over time, based on saved balance snapshots.
Interacting with the Graph
- Hover over the graph to see the exact balance and date at any point
- Click on a snapshot point to open the snapshot management dialog (edit, delete, or download)
- Double-click to reset the zoom level
- Scroll wheel to zoom in or out on the data
- Drag to pan across the timeline
Timeframe Selection
Use the buttons above the graph to switch between timeframes:
- 1W — Last week
- 2W — Last 2 weeks
- 1M — Last month [Premium]
- 3M — Last 3 months [Premium]
- 1Y — Last year [Premium]
- All — Full history since your first snapshot [Premium]
NOTE
Free users can access the 1W and 2W timeframes. The longer timeframes (1M, 3M, 1Y, All) require a premium subscription. Timeframe buttons are also disabled if there are not enough snapshots to cover that period.
Snapshot Controls
The snapshot dropdown button (next to the graph) provides:
- Force Save — Manually trigger a balance snapshot. Shows when the last snapshot was taken.
- Ignore Errors — A checkbox to save snapshots even if some external service queries failed. This setting persists across sessions.
- Import Snapshot — Upload previously exported snapshot CSV files (balance snapshot file + location data snapshot file). After import, rotki will log you out to apply the changes.
For more details on managing snapshots, see Balance Snapshots.
Balance Summary
Below the graph, three columns break down your balances by source:
Exchange Balances
Shows the total value held in each connected exchange. Click on an exchange name to navigate to its detailed balance view. If no exchanges are connected, an add button is shown to link one. To add an exchange connection, see Exchange API Keys.
Blockchain Balances
Lists each blockchain network where you have tracked accounts, with the total value per chain. Click on a chain name to view the accounts on that specific network.
The refresh button on this card has a dropdown with two options:
- Only Refresh Balances — Re-queries balances for all tracked addresses (default)
- Redetect Tokens — Also scans for newly acquired tokens before refreshing balances
To add blockchain accounts, see Accounts.
Manual Balances
Displays manually tracked balances grouped by location (e.g., External, Blockchain, specific exchanges). These are useful for tracking assets that rotki can't query automatically, such as real estate, stocks, or assets on unsupported chains. See Manual Balances for how to add them.
Assets Table
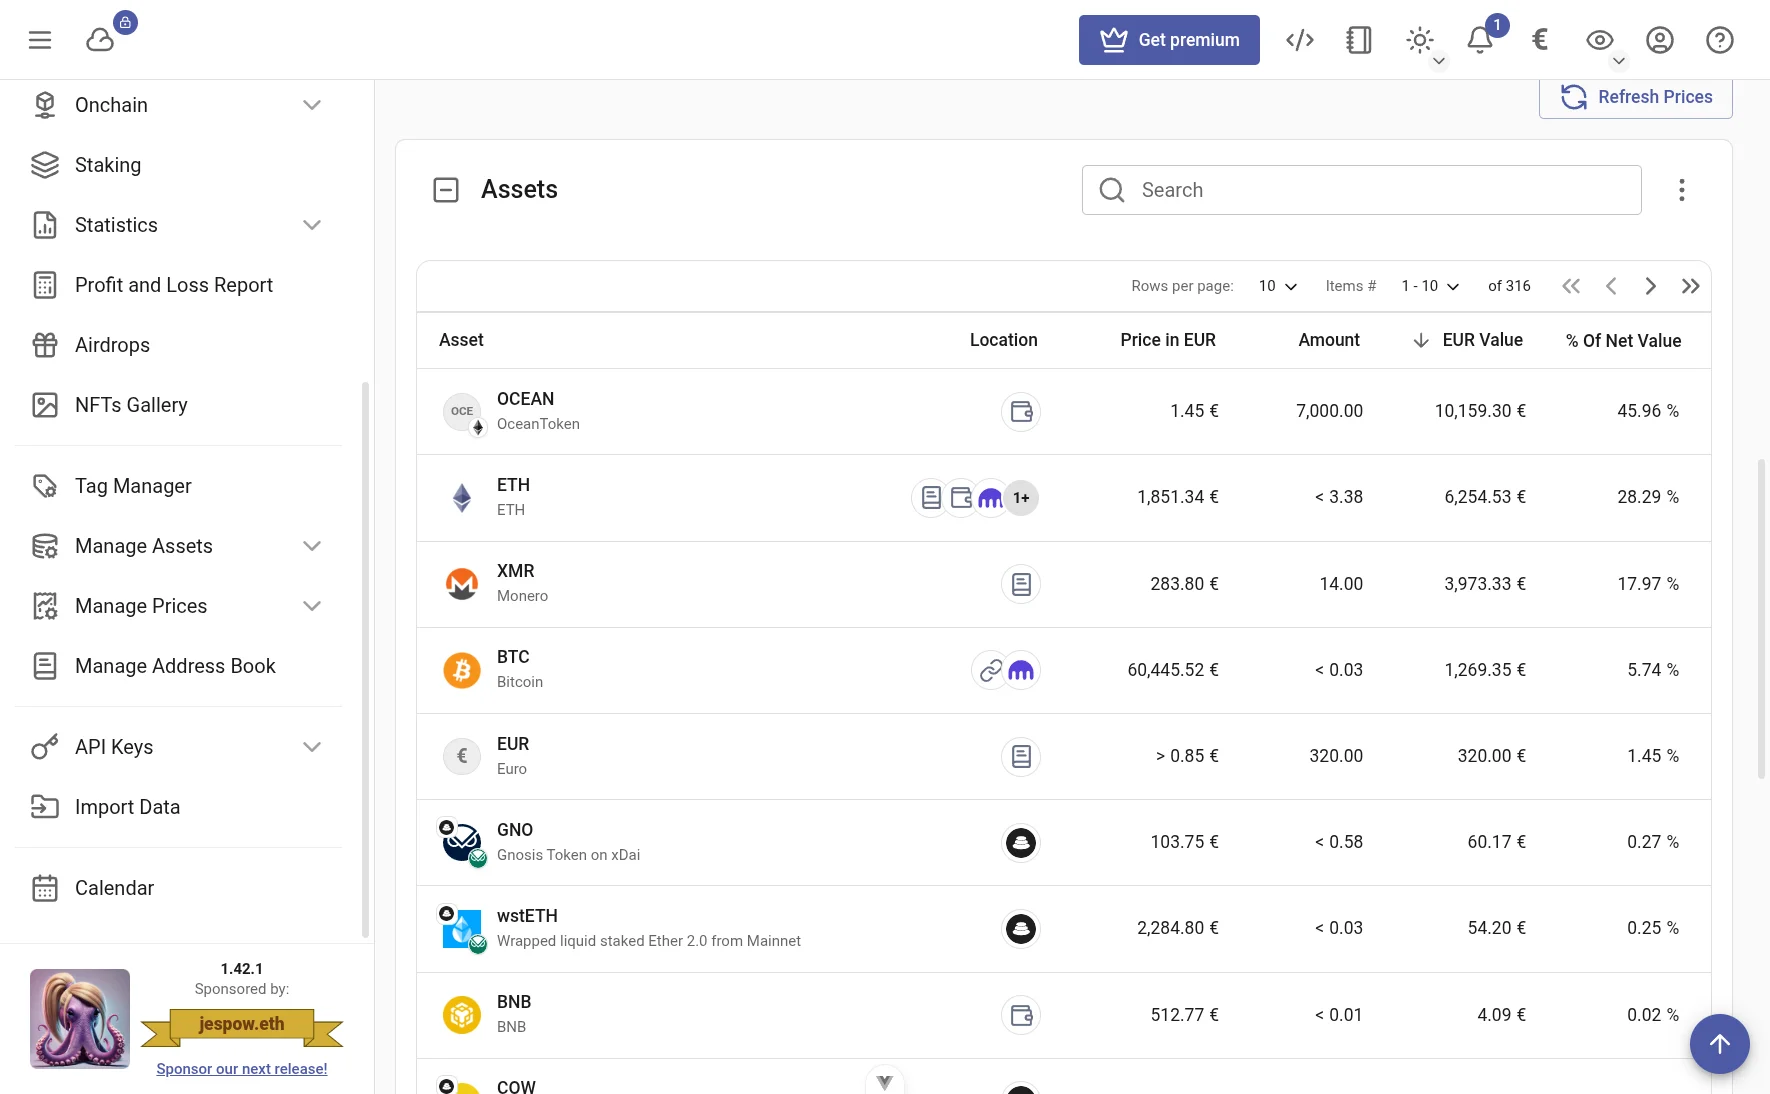
The assets table shows all your holdings aggregated across all sources. Each row displays:
| Column | Description |
|---|---|
| Asset | The asset name, symbol, and the chain it's on (for tokens) |
| Location | Icons showing where the asset is held (blockchain, exchange, manual) |
| Price | Current price in your profit currency |
| Amount | Total quantity you hold |
| Value | Total value in your profit currency |
| % of Net Value | What percentage of your total portfolio this asset represents |
Table Features
- Sorting — Click any column header to sort. Default sort is by value (descending).
- Search — Use the search box to filter by asset name or symbol.
- Pagination — Configure how many rows to display per page using the "Rows per page" dropdown.
- Column Visibility — Click the column configuration button to toggle optional columns ("% of Net Value" and "% of Group").
- Row Expansion — Click the expand arrow on a row to see a detailed breakdown of where that asset is held (per chain, per exchange, per protocol).
- Total Row — A summary row at the bottom shows the aggregate value of all displayed assets.
TIP
If an asset shows a warning icon, it means the asset is not recognized by rotki's asset database. You can click the warning to navigate to the manual balance page for that asset.
Liquidity Pools
If you have assets in DeFi liquidity pools, a Liquidity Pools table appears below the assets table. It shows:
- Pool name with icons for the constituent assets
- Total value of your position
- Percentage of net value
Click the expand arrow to see the detailed asset composition of each pool.
NOTE
Some liquidity pool details are only available with a premium subscription. These are indicated by a lock icon.
Liabilities
If you have any tracked liabilities (debts), a Liabilities table appears with the same structure as the assets table, showing your outstanding obligations.
NFT Balances
If the NFT module is enabled, the NFT Balances table shows NFTs owned by your tracked accounts:
- NFT name and collection
- Price in the NFT's native asset
- Estimated value in your profit currency
- Percentage of your net value
Click the link icon to navigate to the full NFT balances page for more details on managing NFT prices and display settings.
Refreshing Data
Click Refresh Prices below the balance summary to update all asset prices from the configured price oracles.
To refresh balances from specific sources, use the refresh button on the individual balance summary columns (Exchange, Blockchain, or Manual).